Skip to content

Nextora / Analytics & reporting

See what changed.
Know where to look.

This setup brings together
  • CRM
  • Analytics
View setup
Saved board/analytics
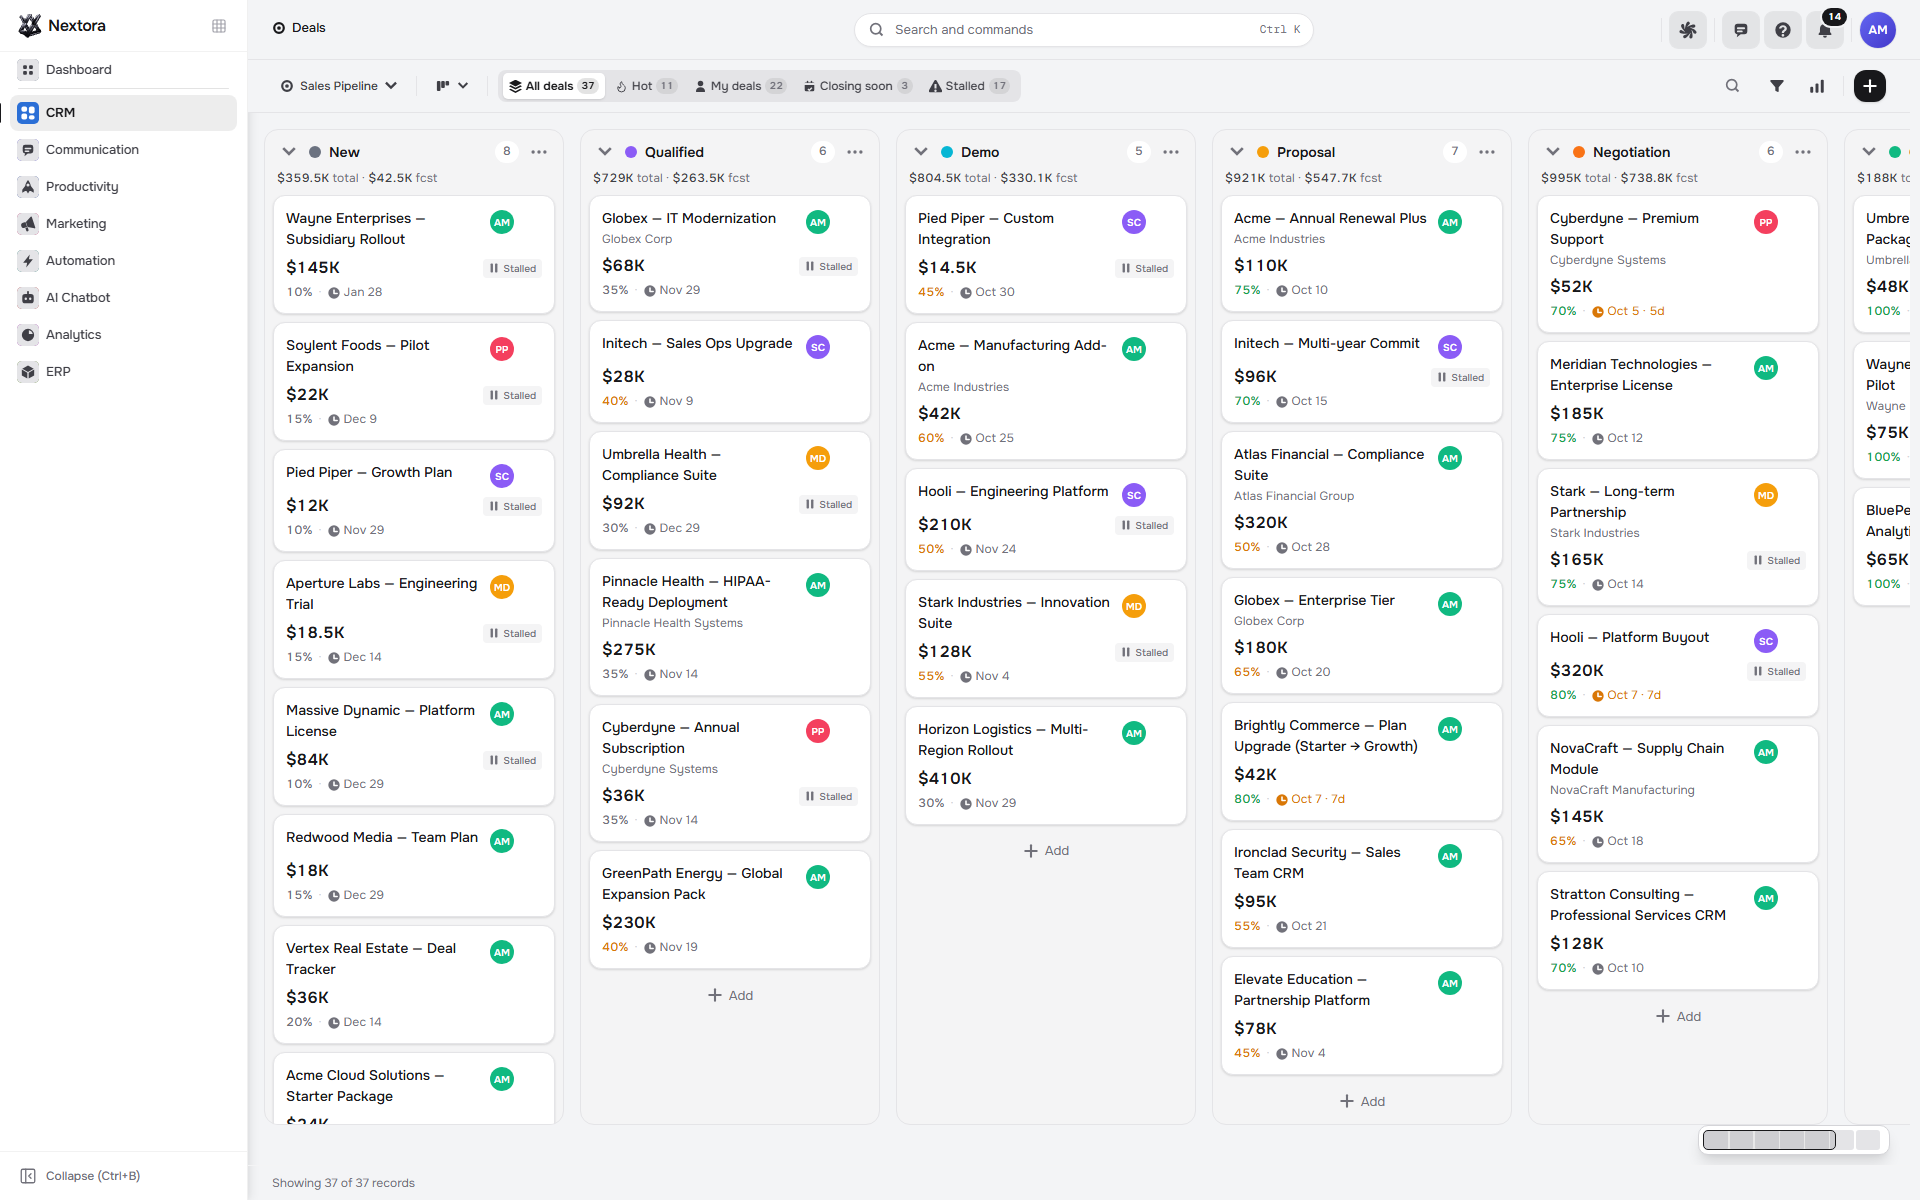
Actual Nextora interface: Bring the answer into the sales meeting.
Saved board Product screenshot
Actual Nextora interface: Bring the answer into the sales meeting.
Actual saved board from the accepted AI plan · demonstration recordsCRM + Analytics
Live report previewsYour metrics and filtersScheduled delivery

Make room
for the decision.

Before the sales review, someone still has to choose the measures, arrange the charts and explain what changed.

Start with the question. Let AI propose the board, review the plan, then bring a useful view into the conversation.

Follow the real board
A clearer view of the work
Brand illustration A clearer view of the work
Ask AI

Tell the builder what the team needs to understand.

A useful sales board starts with relevant measures and a clear way to see their movement.

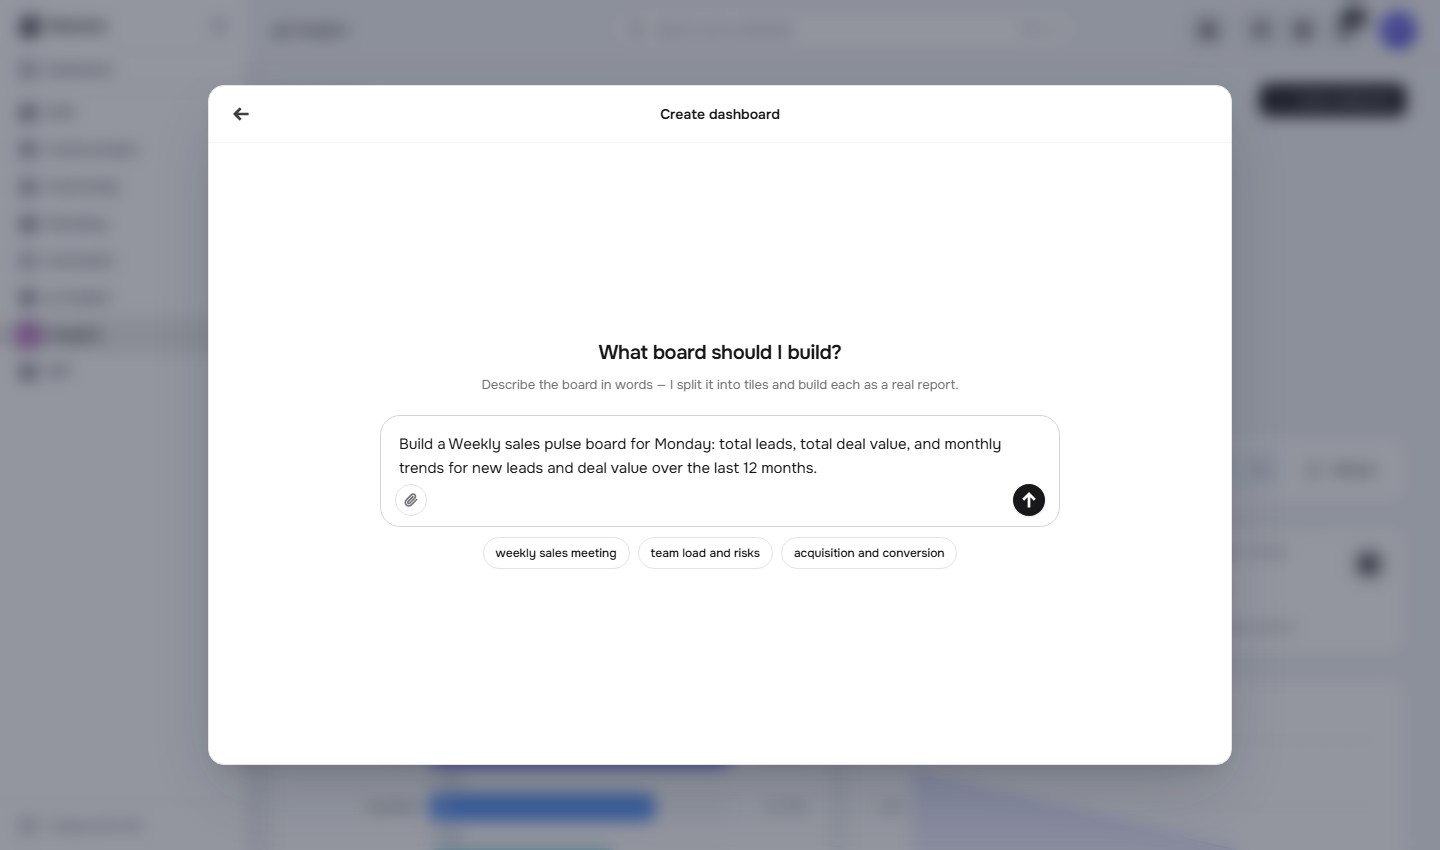
Ask for total leads, total deal value and two monthly trends. Review the proposed metrics and charts before accepting the AI plan.

  • A business question translated into a proposed view.
  • Metrics and charts named before creation.
Ask AI/analytics
Actual Nextora interface: Start with the question behind the meeting.
Ask AI Product screenshot
Actual Nextora interface: Start with the question behind the meeting.
Actual AI creation request and completed plan · before acceptanceCRM + Analytics · AI generation configured

The team gets a specific plan to assess, with the question still visible behind the layout.

Open the board

Put the totals beside the trend.

The team needs a common picture of both the size of the pipeline and its movement.

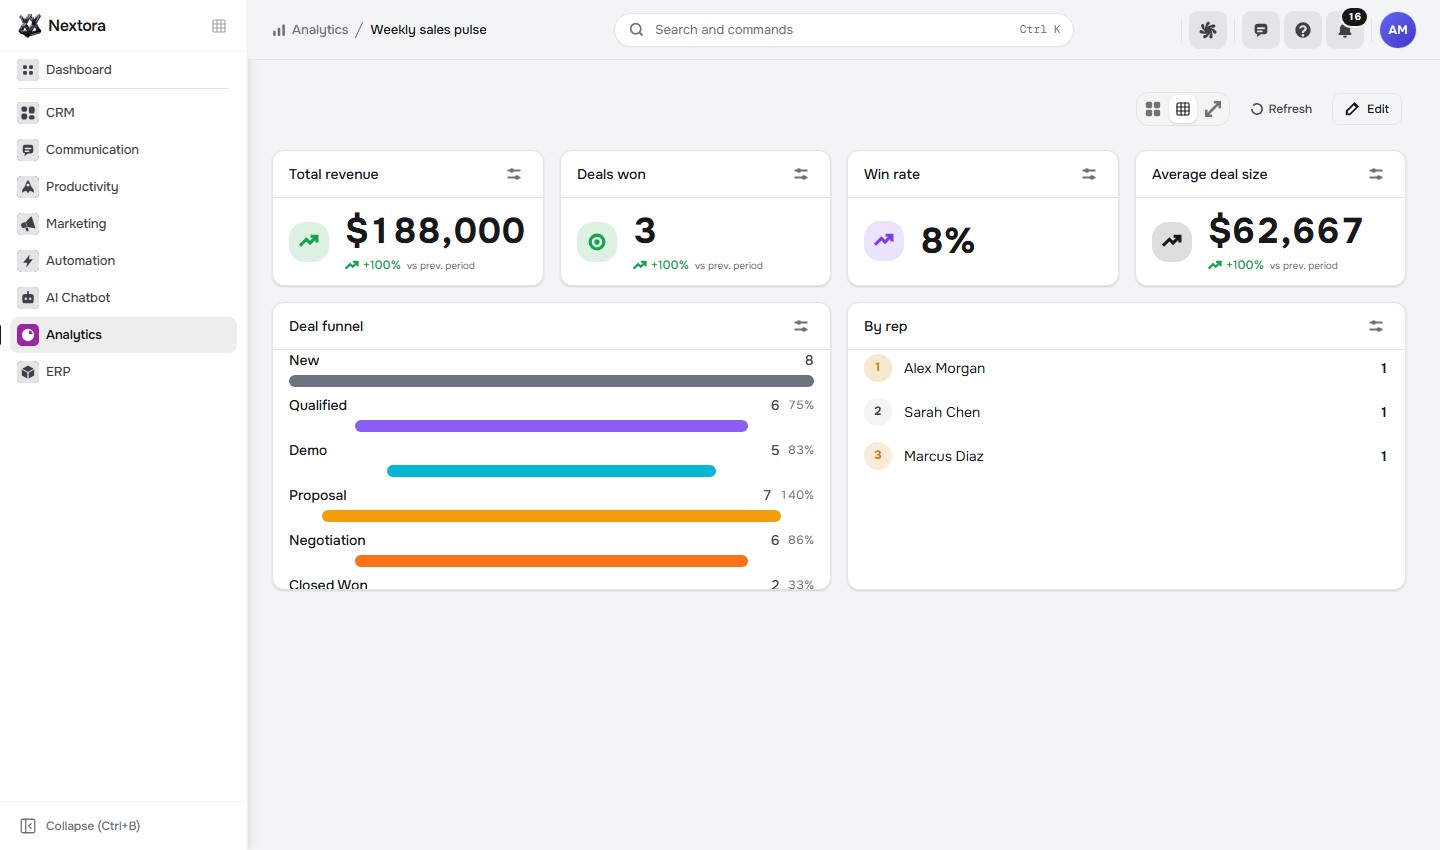
Open the saved Weekly sales pulse board to review lead count, total deal value and the two monthly line charts together.

  • Headline measures and monthly trends on one board.
  • A saved view for the next sales review.
Saved board/analytics
Actual Nextora interface: Bring the answer into the sales meeting.
Saved board Product screenshot
Actual Nextora interface: Bring the answer into the sales meeting.
Actual saved board from the accepted AI plan · demonstration recordsCRM + Analytics

The accepted AI plan becomes a working board the team can open and discuss.

Shape the report

Make the view answer the next question.

The next decision may need a different measure, a closer grouping or a more relevant set of records.

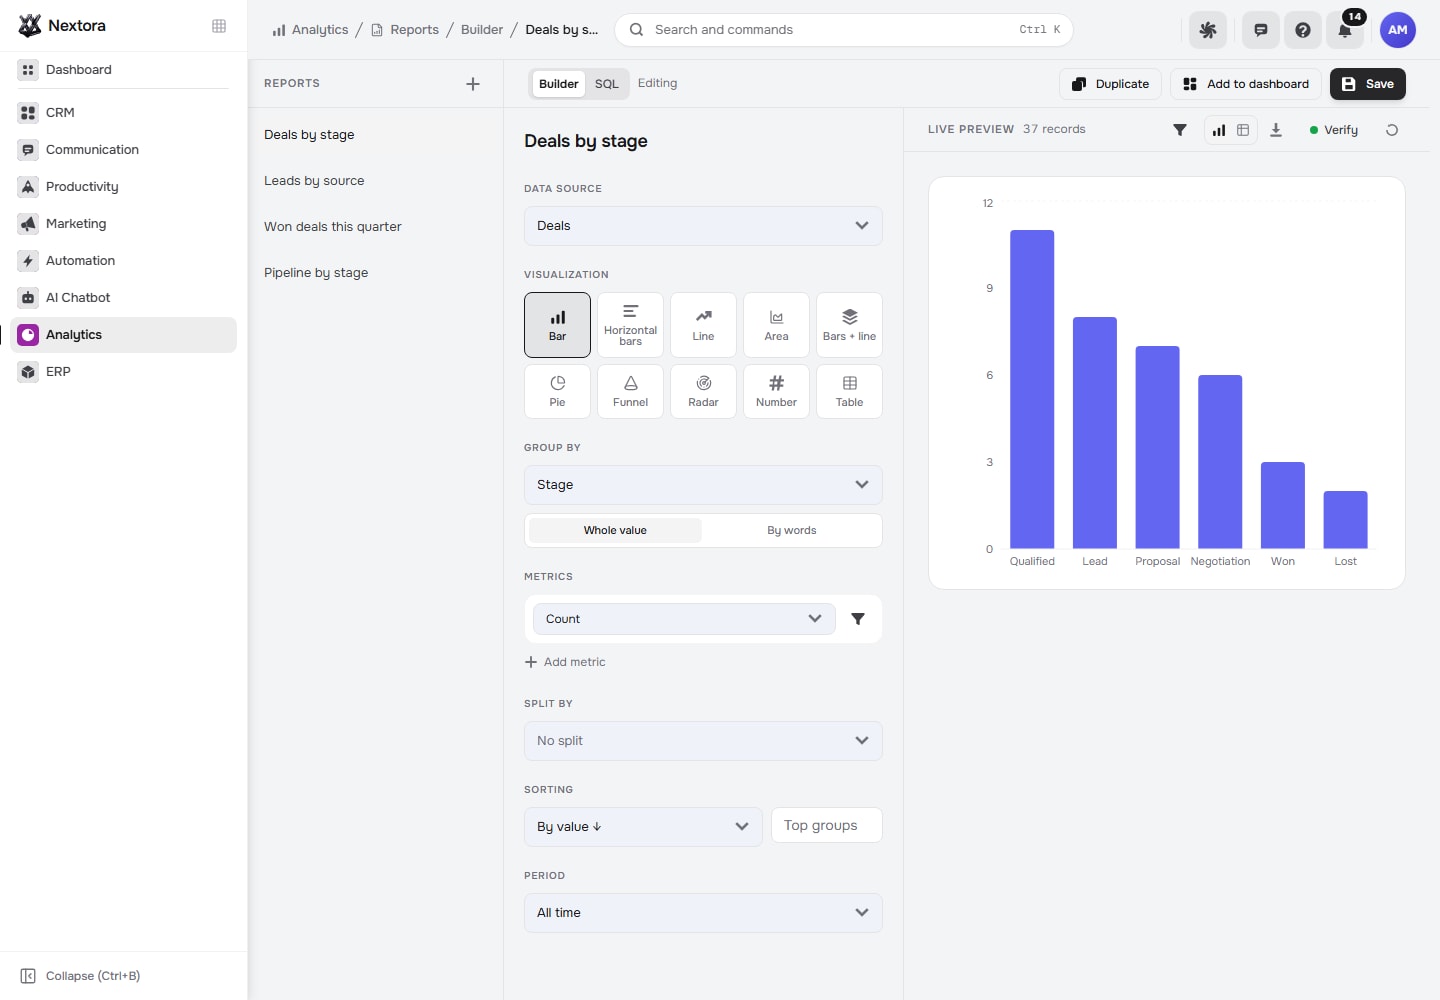
Choose the report source, measures, grouping and filters, and inspect the preview as you shape the report.

  • Direct control over the report’s definition.
  • A visible preview while choosing the settings.
Report builder/reports/builder
Actual Nextora interface: Make the view answer your next question.
Report builder Product screenshot
Actual Nextora interface: Make the view answer your next question.
Actual report builder · demonstration records and configurationCRM + Analytics

The report can follow the team’s question as the discussion becomes more specific.

The tools behind the work

Built around the way you work.

Explore every feature ↗

Understand sales · CRM + Analytics

  • Sales overview
  • Revenue & conversion
  • Pipeline analytics
  • Forecast & loss reasons
  • Task metrics · with Tasks
  • Conversation sentiment · with Inbox & AI setup

Build your view · Analytics

  • AI dashboards · with AI generation setup
  • Dashboard widgets
  • Report builder
  • Metrics & grouping
  • Periods & filters
  • Live previews
  • CSV & XLSX datasets

Keep the team informed

  • Ready-made CRM reports
  • Saved report library
  • Folders & favourites
  • KPI formulas
  • Record tables & breakdowns
  • Report exports
  • Scheduled email delivery
White work surfaces connected by one continuous graphite path
A visual idea of connected work

The picture belongs
beside the work.

The sales review and the sales records belong in the same workspace. Bring CRM and Analytics together, from the customer context to the view your team discusses.

The sales board shown here uses CRM data. AI board creation also needs AI generation configured.

Build your reporting workspace
Your Nextora setup

Put the picture and the work in one workspace.

Start with CRM and Analytics for the sales views shown here. Add Tasks for work metrics, Inbox for customer conversations or your own CSV and XLSX datasets.

A shared foundation

Contacts, companies and workspace access are part of every setup. CRM adds the sales layer.

The setup shown here.

The sales reports shown use CRM data. Other reports need their corresponding records or an uploaded dataset.

  • CRM

    Leads, deals, pipelines and customer history.

  • AnalyticsAdd-on

    Reports and dashboards for connected data sources.

Connect more when you need it
  • Tasks

    Report on tasks and the team’s activity.

  • Conversations

    Explore customer communication data.

  • AI Assistant

    Review AI assistance for building and reading reports.

Additional modules and access are agreed separately.

Discuss this setup

Private alpha · We’ll confirm the modules, connections and pricing for your workflow.

A few things to know.

Can we build reports around our own metrics?

Choose a data source, metrics, grouping, split, period and filters in the report builder. A live preview shows the result as you configure it.

Can we bring in data from outside Nextora?

Upload a CSV or XLSX file to create a report source. Workspace sources come from the modules you connect, such as CRM for deals or Tasks for work metrics.

Can reports arrive on a schedule?

Scheduled reports let you choose the frequency, time of day, attachment format and recipients for email delivery. You can also keep useful reports in folders and favourites.

What is needed for the views on this page?

The sales walkthrough uses CRM and Analytics. Task and conversation reports need their corresponding modules. AI dashboard generation also needs an AI setup; it is separate from importing a dataset or building a report manually.